When developing and running tests, you may have the following questions:
- Is this amount of test cases appropriate ?
- Is the number of defects you find reasonable ?
It is difficult to answer “It is too small quantity. It is too large quantity” because of no basis.
In Japan, there is a “zone analysis” to solve the problems of them.
- [Step1] Get the data to start Zone analysis
- [Step2] Calculate test case density and detection defect density
- [Step3] Do Zone analysis
- What numerical value should be used as the reference value in the initial project?
- When measuring the development scale with FP (Function Point)
- When measuring the development scale with SLOC (Source Lines of Code)
Zone analysis uses two different metrics criteria to visualize and assess achievement / non-achievement.
[Original page] Zone analysis (Japanese)
[Step1] Get the data to start Zone analysis
First of all, let’s prepare the following four data.
- The scale of software like KSLOC(Kilo Source Line Of Code) or FP(Function Point)
- The number of test cases
- The number of defects
- Reference evaluation data (Test case density (Upper limit, Base, Lower limit), Detection defect density (Upper limit, Base, Lower limit))
The scale of software (SLOC or FP)
Source lines of code (SLOC) and function point (FP) are well-known as software metric used to measure the size of a computer program.
IPA (Information-technology Promotion Agency, Japan) defins calculation method of SLOC and FP.

Software Development Data White Paper by IPA
The definition of SLOC and FP (based on IPA) are as below.
The definition of SLOC
SLOC is a count of lines in the text of the program’s source code excluding comment lines and blank lines.
KSLOC means 1,000 source lines of code.
The number of test cases
Since the test cases to be executed are separated for each test phase, prepare the number of test cases for each phase, not the total number through the project.
| Test type | The number of test cases |
|---|---|
| Unit Test | 10,000 |
| Integration Test | 5,000 |
| System Test | 2,000 |
The number of defects
Get the number of defects detected for each process as well as the number of test cases.
| Detection phase | The number of test defects |
|---|---|
| Unit Test | 2,000 |
| Integration Test | 500 |
| System Test | 100 |
The detection phase is the process when a bug is detected.
For example, if you find a defect in a unit test while executing system test, you can include it in the system test.
Reference evaluation data
- Test case density (Upper limit, Base, Lower limit)
- Detection defect density (Upper limit, Base, Lower limit)
For this verification data, it is necessary to get the data accumulated in your project.
Numerical data (development scale, new / existing, project characteristics) of the similar project as the analysis target is better.
If you do not have it, please use the reference data at the end of this page.
[Step2] Calculate test case density and detection defect density
Detection defect density [item/KSLOC][item/KFP]
(1) ![\begin{eqnarray*} Detection\:defect \:density\:[item/KSLOC] = \frac{ The\:number\:of\:defects\:[item]}{System\:Scale\:[KSLOC]} \end{eqnarray*}](https://nehori.com/nikki/wp-content/ql-cache/quicklatex.com-5b3adfee362b1108120c5317d288aa6e_l3.png "Rendered by QuickLaTeX.com")
or
(2) ![\begin{eqnarray*} Detection\:defect \:density\:[item/KFP] = \frac{ The\:number\:of\:defects\:[item]}{System\:Scale\:[KFP]} \end{eqnarray*}](https://nehori.com/nikki/wp-content/ql-cache/quicklatex.com-581b5918da9deafb4207c3cf5bdaa5bb_l3.png "Rendered by QuickLaTeX.com")
Test case density [item/KSLOC][item/KFP]
(3) ![\begin{eqnarray*} Test\:case\:density\:[item/KSLOC] = \frac{ The\:number\:of\:test\:case\:[item]}{System\:Scale\:[KSLOC]} \end{eqnarray*}](https://nehori.com/nikki/wp-content/ql-cache/quicklatex.com-43197c9ba55d946f951337b442a2a4c7_l3.png "Rendered by QuickLaTeX.com")
or
(4) ![\begin{eqnarray*} Test\:case\:density\:[item/KFP] = \frac{ The\:number\:of\:test\:case\:[item]}{System\:Scale\:[KFP]} \end{eqnarray*}](https://nehori.com/nikki/wp-content/ql-cache/quicklatex.com-6e6c3deffa37a98cc3d4f263ef97bcc1_l3.png "Rendered by QuickLaTeX.com")
[Step3] Do Zone analysis
Let’s use zone analysis !
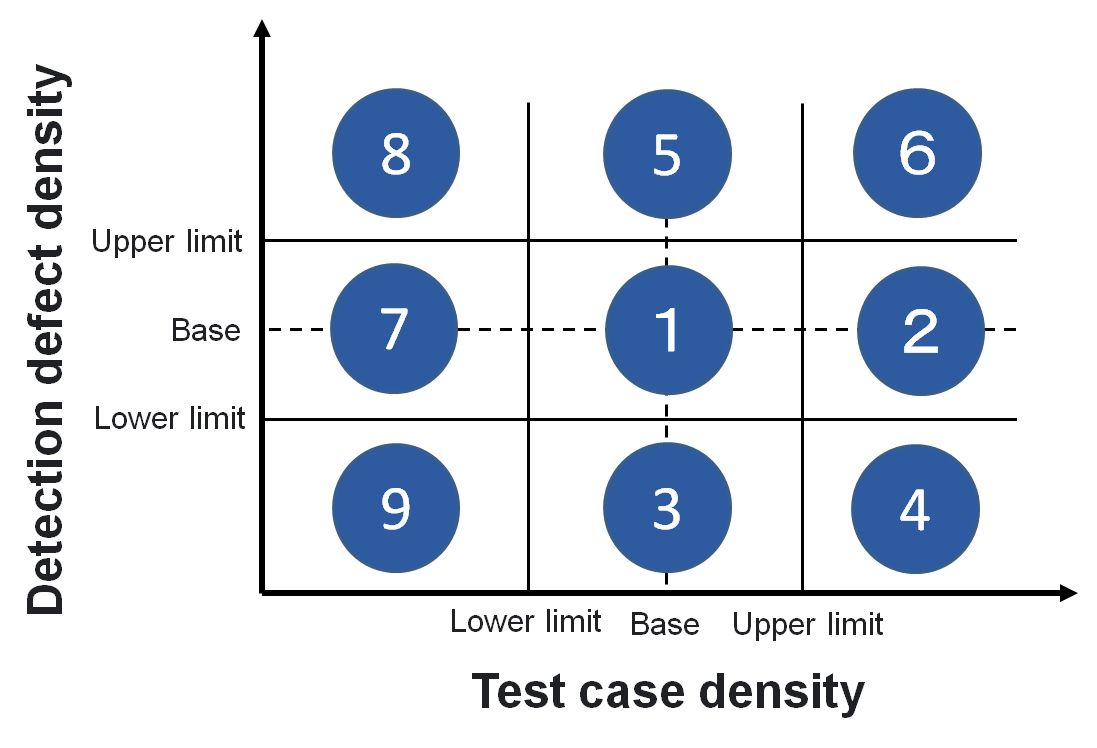
Zone analysis uses four numerical values of “detection defect density” (upper limit, lower limit) and “test case density” (upper limit, lower limit), classifies them into nine zones, and analyzes whether the test status of the target project is appropriate.
Example) New development, aggregation by SLOC, integration test
Consider the following project.
| KSLOC | 400 |
| The number of test cases | 16,000 |
| The number of defects | 800 |
| Test case density | 40.0 |
| Detection defect density | 2.0 |

Zone (1)
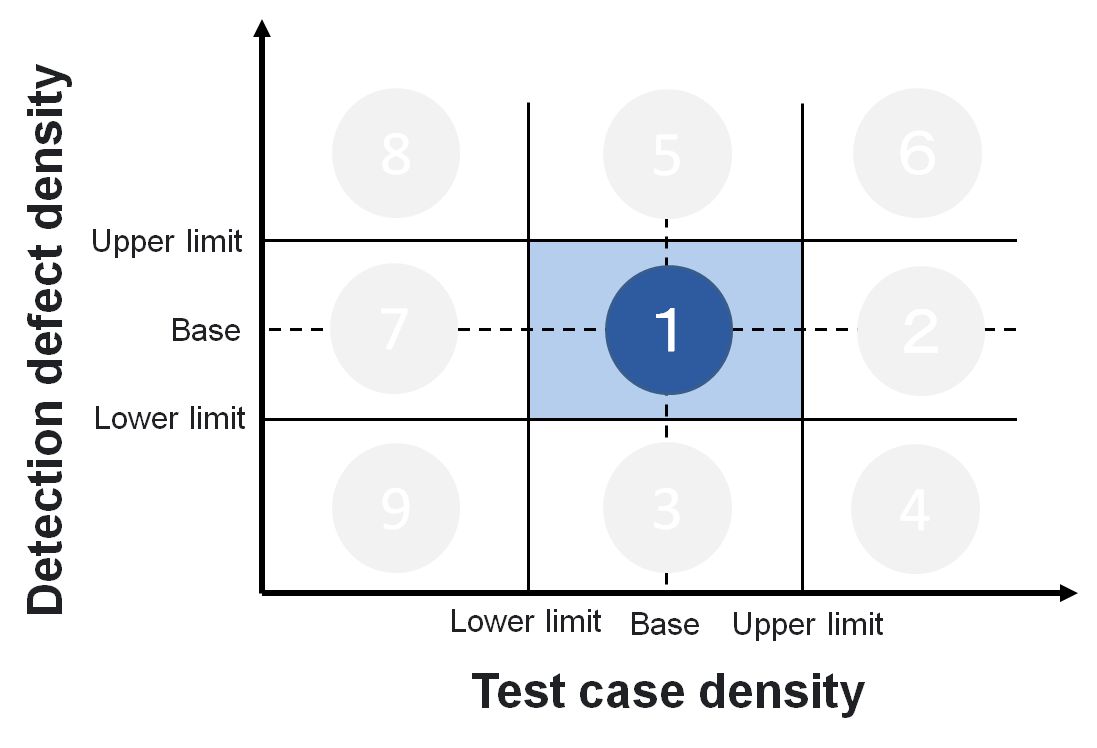
Both the number of test cases and the number of detected defects are reasonable numbers.
There is no problem in zone analysis point of view, so let’s proceed as it is.
Zone (2),(4)
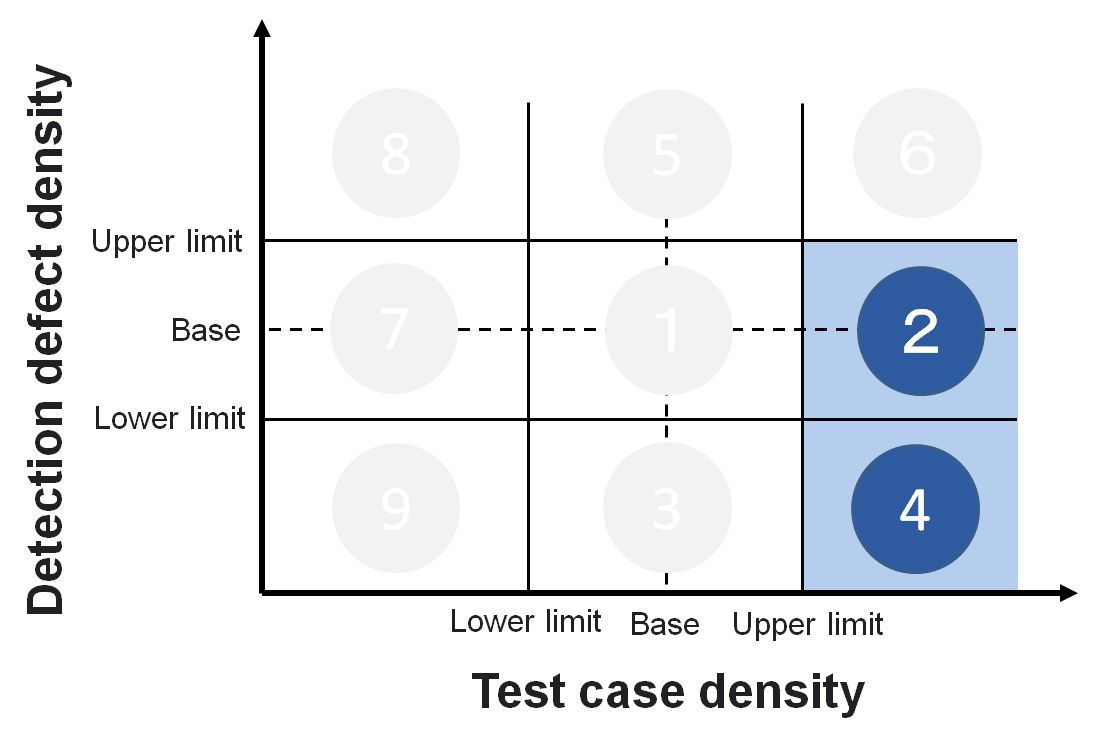
Despite executing the tests, the number of bugs extracted is small.
The quality of the test case may be poor.
Zone (5),(6)
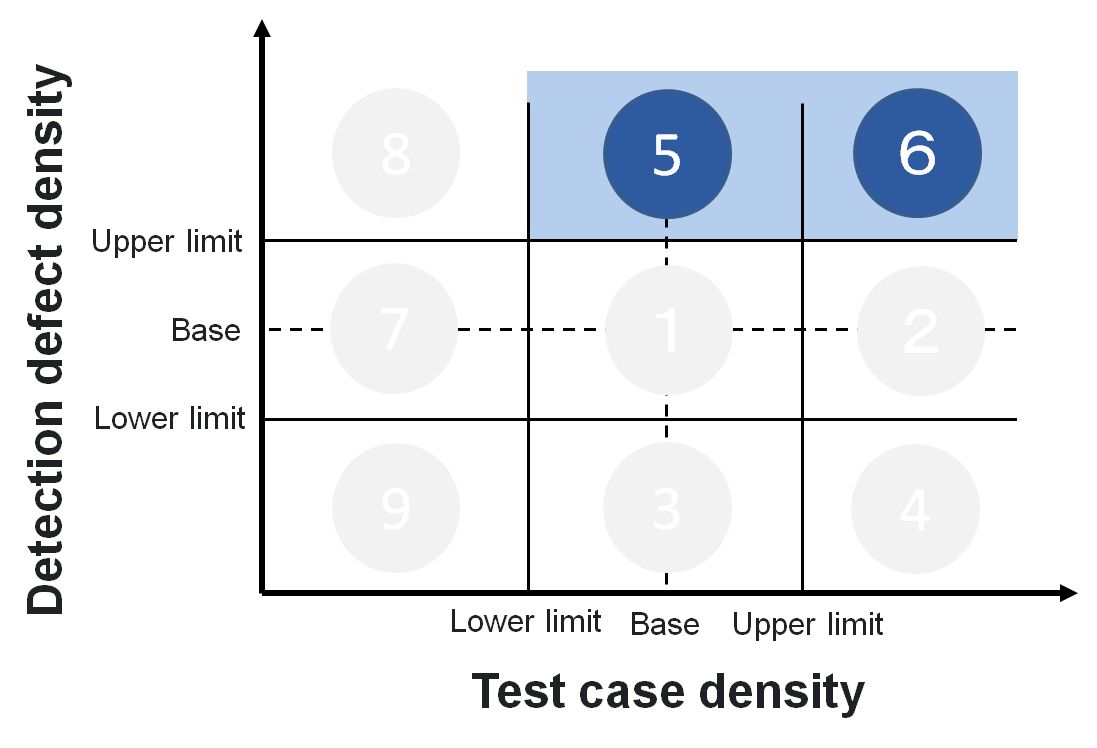
The number of test cases to execute is reasonable, but the number of bugs occurring is large.
There should be something wrong with the design or coding phase.
We recommend that you stop executing the test and investigate the root cause of the problem for the these phase.
Zone (7),(8)
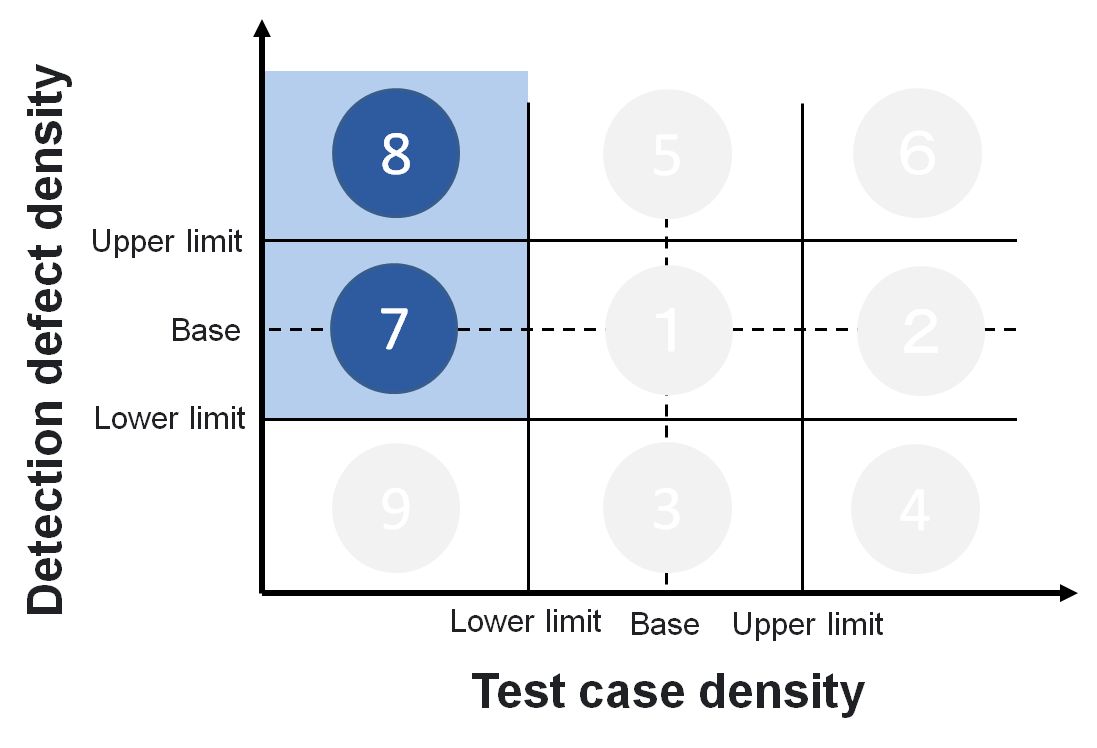
There are not enough test cases to find defects.
In addition, despite the lack of test cases, the number of defects is high, so there should be a defect in the design phase or coding process.
We recommend that you stop executing the test and investigate the root cause of the problem for the these phase.
In addition, review whether you have enough test cases.
Zone (9)

There are not enough test cases.
The number of defects to be detected is small because test cases is insufficient.
In this case, there are not enough test cases, so check if the test cases are covered.
What numerical value should be used as the reference value in the initial project?
In some cases, there are no criteria such as past experience or achievements.
Then, you can use the information provided by IPA (Information-technology Promotion Agency, Japan).
This book defined these data based on from 3,000 to 4,000 projects.
There are also the lists of the detection defect density and test case density.
I have extracted the relevant data, so please use the relevant data for zone analysis.
When measuring the development scale with FP (Function Point)
All development projects
Integration Test
|
Lower limit (P25) |
Base (Median) |
Upper limit (P75) |
|
|
Test case density |
875.5 |
2054.8 |
4,977.5 |
|
Detection defect density |
36.8 |
97.9 |
178.2 |
System Test
|
Lower limit (P25) |
Base (Median) |
Upper limit (P75) |
|
|
Test case density |
252.4 |
586.6 |
1445.3 |
|
Detection defect density |
7.0 |
24.9 |
52.7 |
New development project
Integration Test
|
Lower limit (P25) |
Base (Median) |
Upper limit (P75) |
|
|
Test case density |
739.5 |
1790.5 |
2811.9 |
|
Detection defect density |
67.6 |
123.7 |
268.6 |
Integration Test
|
Lower limit (P25) |
Base (Median) |
Upper limit (P75) |
|
|
Test case density |
204.1 |
441.0 |
958.2 |
|
Detection defect density |
10.0 |
32.7 |
54.3 |
Improvement development project
Integration Test
|
Lower limit (P25) |
Base (Median) |
Upper limit (P75) |
|
|
Test case density |
1656.3 |
3346.9 |
6407.3 |
|
Detection defect density |
30.0 |
57.8 |
102.4 |
Integration Test
|
Lower limit (P25) |
Base (Median) |
Upper limit (P75) |
|
|
Test case density |
574.2 |
1242.9 |
3018.2 |
|
Detection defect density |
5.8 |
23.3 |
67.7 |
When measuring the development scale with SLOC (Source Lines of Code)
All development projects
Integration Test
|
Lower limit (P25) |
Base (Median) |
Upper limit (P75) |
|
|
Test case density |
23.5 |
50.5 |
114.4 |
|
Detection defect density |
0.541 |
1.301 |
2.548 |
Integration Test
|
Lower limit (P25) |
Base (Median) |
Upper limit (P75) |
|
|
Test case density |
6.2 |
14.8 |
40.2 |
|
Detection defect density |
0.060 |
0.248 |
0.724 |
New development project
Integration Test
|
Lower limit (P25) |
Base (Median) |
Upper limit (P75) |
|
|
Test case density |
17.85 |
35.70 |
64.27 |
|
Detection defect density |
0.943 |
1.600 |
2.626 |
Integration Test
|
Lower limit (P25) |
Base (Median) |
Upper limit (P75) |
|
|
Test case density |
3.92 |
9.31 |
17.94 |
|
Detection defect density |
0.112 |
0.320 |
0.833 |
Improvement development project
Integration Test
|
Lower limit (P25) |
Base (Median) |
Upper limit (P75) |
|
|
Test case density |
32.98 |
65.72 |
171.76 |
|
Detection defect density |
0.308 |
1.101 |
2.425 |
Integration Test
|
Lower limit (P25) |
Base (Median) |
Upper limit (P75) |
|
|
Test case density |
8.70 |
24.80 |
69.85 |
|
Detection defect density |
0.033 |
0.183 |
0.721 |