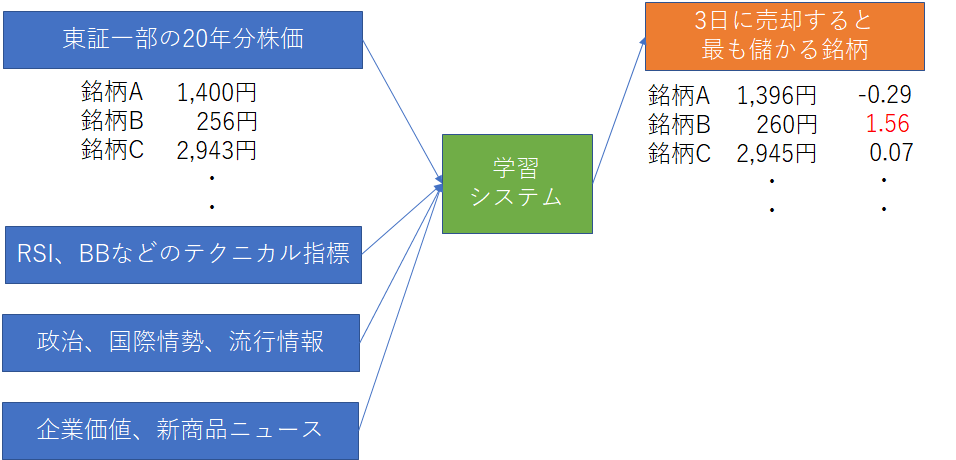
以前、LSTMを使ってKerasで実現した学習モデルでは、「一つ手前のデータと、これまでのパターンから次の値を予測する」結果になってしまいました。
勝率も49%でした。
このアプローチにずっと疑問を持っていましたが、学習データやモデル構築の知識が不足しており手が出せませんでした。
例えば・・・・
- よく見るモデルの多くは、株価が上がるか下がるかの2通りを予測するもの
- 学習データのほとんどが日経平均や、1つの企業の株価データのみ
- 勝率で計算しており、利益計算になっていない(勝率が49%でも利益が高ければ問題ないはず)
- 売りはしないし毎日売買するつもりはないので、多くの利益が出る時に買いができればよい
のような点は、Protraと比べても劣ってます。
最終的には、ファンダメンタルズ分析や市場動向まで加味したモデルを作りたいです。
まだまだ知識も技術も足りないので、急いではいません。
テクニカル分析における代表的な指標を算出するために「TA-Lib」というライブラリを利用します。
python3.8上にTA-Libをインストール
pipコマンドでそのままではインストールできません。
「https://www.lfd.uci.edu/~gohlke/pythonlibs/#ta-lib」に存在するcp38をダウンロードします。
32bitOS ⇒ TA_Lib‑0.4.17‑cp38‑cp38‑win32.whl
64bitOS ⇒ TA_Lib‑0.4.17‑cp38‑cp38‑win_amd64.whl
次に、各OSに合わせてインストール。
32bitOS
|
1 |
pip install TA_Lib‑0.4.17‑cp38‑cp38‑win32.whl |
64bitOS
|
1 2 3 4 |
$ /c/Python38/Scripts/pip install TA_Lib-0.4.17-cp38-cp38-win_amd64.whl Processing c:\users\0000123921\desktop\ta_lib-0.4.17-cp38-cp38-win_amd64.whl Installing collected packages: TA-Lib Successfully installed TA-Lib-0.4.17 |
TA-Libで株価のテクニカル指標をチェック
Protraからトヨタ(7203)の株価をCSVとして出力して、テクニカル指標をプロットしてみます。
|
1 2 3 4 5 6 7 8 9 10 11 12 13 14 15 16 17 18 19 20 21 22 23 24 25 26 27 28 29 30 31 32 33 34 35 36 37 38 39 40 41 42 43 44 45 |
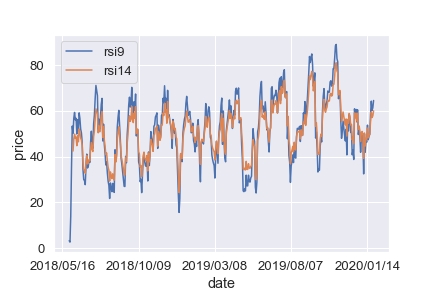
import talib # グラフ出力 def display_chart(data, x): sns.set(font_scale = 1.2) fig = plt.figure() for i in range(len(data)): plt.plot(x, data[i][0], label=data[i][1]) plt.xticks(range(0, len(x), 100), x[::100]) plt.xlabel('date') plt.ylabel('price') plt.legend() plt.show() # ファイルに保存 fig.savefig("img.png") # テクニカル指標 def add_new_features(df): # Simple Moving Average close = df['close'] sma5 = talib.SMA(close, timeperiod=5) sma25 = talib.SMA(close, timeperiod=25) sma50 = talib.SMA(close, timeperiod=50) sma75 = talib.SMA(close, timeperiod=75) sma100 = talib.SMA(close, timeperiod=100) display_chart( [[sma5,"sma5"],[sma25,"sma25"],[sma50,"sma50"],[sma75,"sma75"],[sma100,"sma100"]], df['date']) # Bollinger Bands upper1, middle,lower1 = talib.BBANDS(close, timeperiod=25, nbdevup=1, nbdevdn=1, matype=0) upper2, middle, lower2 = talib.BBANDS(close, timeperiod=25, nbdevup=2, nbdevdn=2, matype=0) upper3, middle, lower3 = talib.BBANDS(close, timeperiod=25, nbdevup=3, nbdevdn=3, matype=0) display_chart( [[upper1,"upper1"],[lower1,"lower1"],[upper2,"upper2"],[lower2,"lower2"],[upper3,"upper3"],[lower3,"lower3"]], df['date']) # MACD - Moving Average Convergence/Divergence macd, macdsignal, macdhist = talib.MACD(close, fastperiod=12, slowperiod=26, signalperiod=9) display_chart( [[macd,"macd"],[macdsignal,"macdsignal"],[macdhist,"macdhist"]], df['date']) # RSI - Relative Strength Index rsi9 = talib.RSI(close, timeperiod=9) rsi14 = talib.RSI(close, timeperiod=14) display_chart( [[rsi9,"rsi9"],[rsi14,"rsi14"]], df['date']) def main(): df_train = pd.read_csv("7203.csv", skiprows=5000, names=("date", "open", "high", "low", "close", "volume")) df_train = add_new_features(df_train) if __name__ == '__main__': main() |
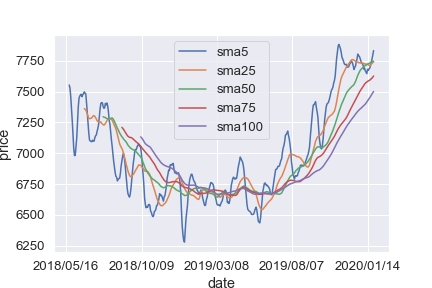
移動平均線
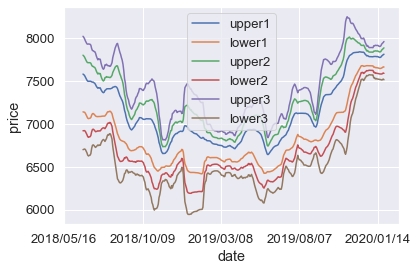
ボリンジャーバンド
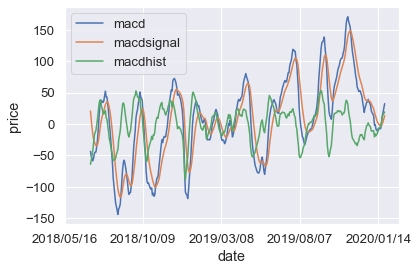
MACD
RSI
「騰落レシオ」などは自分で実装が必要そうです。
※ 5日騰落レシオ = 過去5日間の値上がり銘柄数)/(過去5日間の値下がり銘柄数)×100
ですが、Pythonでクニカル分析指標を表示する程度なら非常に容易な事が分かりました。
テーブルデータを作成する
日付、株価、曜日、移動平均、ボリンジャーバンド、MACD、RSI
で、3日後の株価(3日後の始値 – 翌日始値)を予測します。
「時系列データ」としては、「移動平均」を渡すことで直接は利用しません。
最終的には銘柄毎に学習分類器を作ることで、機械学習で株価予測をしたいと考えています。
学習モデル
Kaggleなどのデータ分析コンペでテーブルデータを扱う場合、最近は取りあえずLightGBMを利用する場合が多いです。
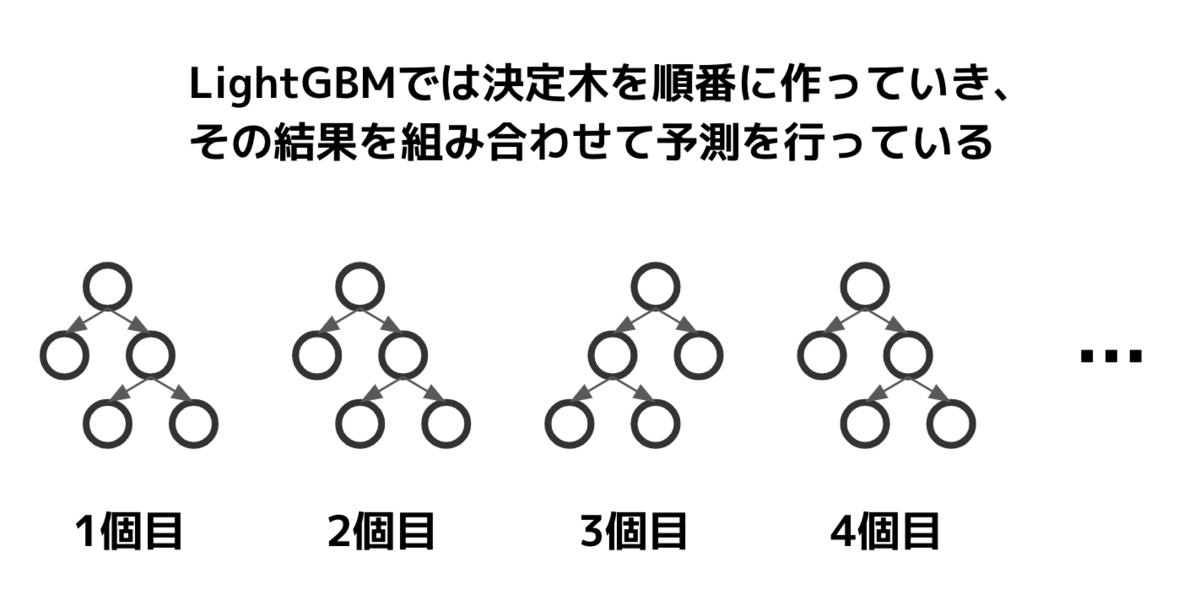
- 欠損値をそのまま扱える
- カテゴリ変数の指定ができる
- 特徴量のスケーリングが不要
- feature importanceが確認できる
- 精度が出やすく最終的なモデルとして残る可能性が高い
- 比較的大きいデータも高速に扱える
ということで今回も「LightGBM」を使って解きます。
出力結果は次のようになりました。
|
1 2 3 4 5 6 7 8 9 10 11 12 13 14 15 16 17 18 19 20 21 22 23 24 25 26 |
X_train:(2727, 23) y_train:(2727,) X_valid:(682, 23) y_valid:(682,) LGBMClassifier Accuracy: 1.0 Time = 25.571837186813354 Total Time = 25.572834730148315 LGBMClassifier was selected [-162. -1. -9. 44. -54. 70. -164. 53. 31. 20. 170. -9. -23. 34. 41. 4. 47. -116. -85. -90. 34. 2. 44. 110. 98. 62. -90. 451. 34. -118. -146. 163. 170. -17. -51. 110. -30. 70. -346. -9. -83. -214. -83. -15. 53. 4. -23. -60. -83. 451. -14. -216. 41. -18. -214. 41. 170. -90. 128. -108. 67. -214. -51. -63. 97. -26. 52. -9. 21. 106. 73. -146. 36. 110. -64. 97. 31. -8. 30. 22. -116. 4.] -------------------------- [-193. 0. 86. 240. 28. -135. -90. -54. -14. 217. 120. 125. 174. -39. -9. 63. 45. -96. -107. 81. 164. -107. 38. -227. -35. 18. -98. 279. 98. -53. -117. 93. 20. -11. 113. 114. -8. 27. 33. 114. 82. 6. 51. -48. -75. -19. 179. 129. -10. 172. 95. -221. -35. 129. -131. -90. 18. 58. 430. 44. 78. 236. -89. -121. 40. -32. 10. 46. 25. 106. 51. 49. 76. 91. -111. 173. 13. 21. 115. -162. -127. -26.] [[18 14] [22 28]] Model[LGBMClassifier] Testing Accuracy = "0.5609756097560976 !" |
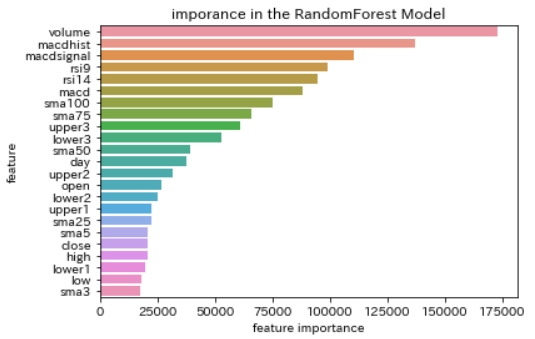
学習モデルが重要と判断した「feature importance」を確認すると次のような順序になっています。
|
1 2 3 4 5 6 7 |
# feature importances fi = model.feature_importances_ fi_df = pd.DataFrame({'feature': list(X.columns), 'feature importance': fi[:]}).sort_values('feature importance', ascending = False) fi_df sns.barplot(fi_df['feature importance'],fi_df['feature']) plt.title("imporance in the Model") |
出来高、MACDなどが重要指標として利用されているようですが、移動平均線3日、5日などを重要視していない点は解せません。
で、肝心の正解率は53%です(学習に使う期間が短いほど正解率は高い)。
今回は、混合行列を使っているので、2値計算(上がったか下がったか)だけの計算で求めました。
利益曲線もProtraのようなシミュレーションは今は実装されていません。
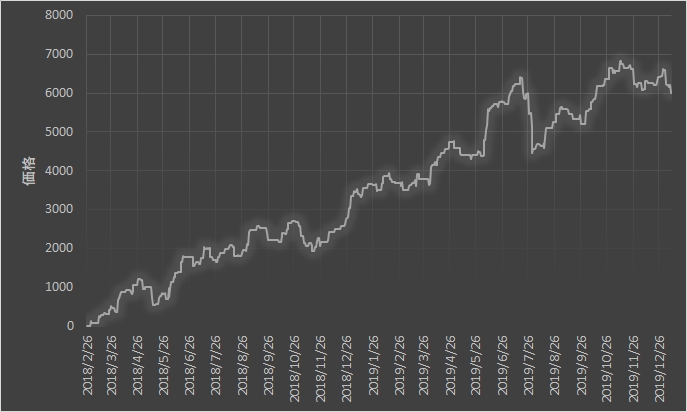
とりあえず株価が+10円より大きく上がったと学習システムが判断した時のみ買いを仕掛けた場合の利益をマニュアルで確認してみます。
|
1 2 3 4 5 6 7 8 9 10 11 12 13 14 |
# 利益計算 def cal_profit(y, y_pred): # 予測 y_pred = np.where(y_pred < 10, 0, 1) csv_df = pd.DataFrame() sum = 0 for i in range(len(y_pred)): if(y_pred[i]): csv_df = csv_df.append([y[i]], ignore_index=True) sum += y[i] else: csv_df = csv_df.append([0], ignore_index=True) print("total profit = " + str(sum)) csv_df.to_csv("profit.csv", index = False) |
購入するのは一株で、計算・グラフ出力ツールとしてExcelを利用しています。
グラフを見ると右肩上がりです。過去一年だけの成績ですが。
まとめ
まだ知識も足りないし精度も低いけれど、今持っている知識で我流で機械学習で株価予想を解けた事を良しとします。
ただし、Protraのように簿価、時価、プロフィットファクターを求めたり、資産1000万円で単利計算、複利計算などが出来ないと分析が難しい。
もはや機械学習のジャンルじゃないね。
そして、株価予測が下落と予測した時は銘柄購入は不要です。
ですので、出来る限り「上昇」する確率が高いことを検知するシステムを構築する必要があります。
色々と苦労している間に優秀なサービス、ツールが出てきそうな気がします。
よく遭遇するエラー
ValueError: DataFrame.dtypes for data must be int, float or bool. Did not expect the data types in fields
pandas.DataFrameの値がLightGBMでは取り込めない文字列型になっている時に発生するエラー。
列を削除するか、ラベルエンコードが必要。
ValueError: Classification metrics can’t handle a mix of multiclass and continuous-multioutput targets
|
1 2 3 4 5 6 7 8 9 10 11 12 |
from sklearn.metrics import confusion_matrix y_true = np.array([0.0, 0.0, 0.0, 0.0, 0.0, -1.0, -1.0, 1.0, 1.0, 1.0]) y_pred = np.array([0.0, 1.0, -1.0, 1.0, 1.0, 0.0, 0.0, 0.0, 1.0, 1.0]) print(y_true) print("The size of df is : "+str(y_true.shape)) print("--------------") print(y_pred) print("The size of df is : "+str(y_pred.shape)) cm = confusion_matrix(y_true, y_pred) print(cm) TN, FP, FN, TP = confusion_matrix(y_true, y_pred).ravel() |
2値計算でないので2 x 2行列になりませんでした。
|
1 2 3 4 5 6 7 8 |
[ 0. 0. 0. 0. 0. -1. -1. 1. 1. 1.] The size of df is : (10,) -------------- [ 0. 1. -1. 1. 1. 0. 0. 0. 1. 1.] The size of df is : (10,) [[0 2 0] [1 1 3] [0 1 2]] |
ソースコード
まだまだ改善の余地がありますが公開します。
|
1 2 3 4 5 6 7 8 9 10 11 12 13 14 15 16 17 18 19 20 21 22 23 24 25 26 27 28 29 30 31 32 33 34 35 36 37 38 39 40 41 42 43 44 45 46 47 48 49 50 51 52 53 54 55 56 57 58 59 60 61 62 63 64 65 66 67 68 69 70 71 72 73 74 75 76 77 78 79 80 81 82 83 84 85 86 87 88 89 90 91 92 93 94 95 96 97 98 99 100 101 102 103 104 105 106 107 108 109 110 111 112 113 114 115 116 117 118 119 120 121 122 123 124 125 126 127 128 129 130 131 132 133 134 135 136 137 138 139 140 141 142 143 144 145 146 147 148 149 150 151 152 153 154 155 156 157 158 159 160 161 162 163 164 165 166 167 168 169 170 171 172 173 174 175 176 177 178 179 180 181 182 183 |
import time import numpy as np import pandas as pd import seaborn as sns import matplotlib.pyplot as plt from xgboost import XGBClassifier from lightgbm import LGBMClassifier from catboost import CatBoostClassifier from sklearn.metrics import confusion_matrix from sklearn.model_selection import train_test_split # 学習用データ、検証用データの割り当て def build_train_valid_data(df, target, train_size = 0.8): # 答えの削除 y_train = df[target] X_train = df.drop([target], axis = 1) # 80% を学習用データ X_train, X_valid, y_train, y_valid = train_test_split(X_train, y_train, train_size = train_size) # 作成した行列出力 print("X_train:{}".format(X_train.shape)) print("y_train:{}".format(y_train.shape)) print("X_valid:{}".format(X_valid.shape)) print("y_valid:{}".format(y_valid.shape)) return X_train, X_valid, y_train, y_valid # 概要出力 def display_overview(df): # それぞれのデータのサイズを確認 print("The size of df is : "+str(df.shape)) # 列名を表示 print(df.columns) # 表の一部分表示 display(df.head(-10)) # 各列のデータの型を表示 print(df.dtypes.sort_values()) clf_names = [ ["LGBMClassifier",""], # ["CatBoostClassifier","logging_level='Silent'"], # ["XGBClassifier",""], ] # 学習モデル構築 def sklearn_model(X_train, y_train): total_start = time.time() models = {} total = 0.0 name = "" for i in range(len(clf_names)): start = time.time() # インスタンス化 clf = eval("%s(%s)" % (clf_names[i][0], clf_names[i][1])) clf.fit(X_train, y_train) score = clf.score(X_train, y_train) print('%s Accuracy:' % clf_names[i][0], score) print(' Time = %s' % str(time.time() - start)) models[clf_names[i][0]] = clf if total <= score: total = score name = clf_names[i][0] print('Total Time = %s' % str(time.time() - total_start)) print('%s was selected' % name) return models import talib # グラフ出力 def display_chart(data, x): sns.set(font_scale = 1.2) fig = plt.figure() for i in range(len(data)): plt.plot(x, data[i][0], label=data[i][1]) plt.xticks(range(0, len(x), 100), x[::100]) plt.xlabel('date') plt.ylabel('price') plt.legend() plt.show() # ファイルに保存 fig.savefig("img.png") # テクニカル指標 def add_new_features(df): # Simple Moving Average close = df['close'] df['sma3'] = talib.SMA(close, timeperiod=3) df['sma5'] = talib.SMA(close, timeperiod=5) df['sma25'] = talib.SMA(close, timeperiod=25) df['sma50'] = talib.SMA(close, timeperiod=50) df['sma75'] = talib.SMA(close, timeperiod=75) df['sma100'] = talib.SMA(close, timeperiod=100) #display_chart( [[df['sma5'],"sma5"],[df['sma25'],"sma25"],[df['sma50'],"sma50"], # [df['sma75'],"sma75"],[df['sma100'],"sma100"]], df['date']) # Bollinger Bands df['upper1'], middle, df['lower1'] = talib.BBANDS(close, timeperiod=25, nbdevup=1, nbdevdn=1, matype=0) df['upper2'], middle, df['lower2'] = talib.BBANDS(close, timeperiod=25, nbdevup=2, nbdevdn=2, matype=0) df['upper3'], middle, df['lower3'] = talib.BBANDS(close, timeperiod=25, nbdevup=3, nbdevdn=3, matype=0) #display_chart( [[df['upper1'],"upper1"],[df['lower1'],"lower1"],[df['upper2'],"upper2"], # [df['lower2'],"lower2"],[df['upper3'],"upper3"],[df['upper1'],"lower3"]], df['date']) # MACD - Moving Average Convergence/Divergence df['macd'], df['macdsignal'], df['macdhist'] = talib.MACD(close, fastperiod=12, slowperiod=26, signalperiod=9) #display_chart( [[df['macd'],"macd"],[df['macdsignal'],"macdsignal"],[df['macdhist'],"macdhist"]], df['date']) # RSI - Relative Strength Index df['rsi9'] = talib.RSI(close, timeperiod=9) df['rsi14'] = talib.RSI(close, timeperiod=14) #display_chart( [[df['rsi9'],"rsi9"],[df['rsi14'],"rsi14"]], df['date']) return df # 利益計算 def cal_profit(y, y_pred): # 予測 y_pred = np.where(y_pred < 10, 0, 1) csv_df = pd.DataFrame() sum = 0 for i in range(len(y_pred)): if(y_pred[i]): csv_df = csv_df.append([y[i]], ignore_index=True) sum += y[i] else: csv_df = csv_df.append([0], ignore_index=True) print("total profit = " + str(sum)) csv_df.to_csv("profit.csv", index = False) # 正解率確認 def output_accuracy(models, X, y): best_model = None best_name = "" total = 0.0 for name, model in models.items(): y_pred = model.predict(X) print(y_pred) #print("The size of df is : "+str(y_pred.shape)) print("--------------------------") print(y.ravel()) cal_profit(y.ravel(), y_pred) #print("The size of df is : "+str(y.shape)) y = np.where(y < 0, 0, 1) y_pred = np.where(y_pred < 0, 0, 1) cm = confusion_matrix(y, y_pred) print(cm) # extracting TN, FP, FN, TP TN, FP, FN, TP = confusion_matrix(y, y_pred).ravel() score = (TP + TN) / (TP + TN + FN + FP) # Accuracy を計算する print('Model[{}] Testing Accuracy = "{} !"'.format(name, score)) print() # feature importances fi = model.feature_importances_ fi_df = pd.DataFrame({'feature': list(X.columns), 'feature importance': fi[:]}).sort_values('feature importance', ascending = False) fi_df sns.barplot(fi_df['feature importance'],fi_df['feature']) plt.title("imporance in the RandomForest Model") if total <= score: best_model = model best_name = name total = score print()# Print a new line print('%s was selected' % best_name) return best_model def main(): df_train = pd.read_csv("7203.csv", skiprows=2000, names=("date", "open", "high", "low", "close", "volume")) # 予測値(3日後の始値の上昇値) df_train['target'] = df_train['open'].shift(-3) - df_train['open'].shift(-1) # 曜日追加 df_train['day'] = pd.to_datetime(df_train['date']).dt.dayofweek # 新特徴データ df_train = add_new_features(df_train) # 欠損値を列の1つ手前の値で埋める df_train = df_train.fillna(method='ffill') # 概要出力 display_overview(df_train) # dateは不要 df_train = df_train.drop("date", axis=1) # データ分割 X_train, X_valid, y_train, y_valid = build_train_valid_data(df_train, 'target', 0.8) # 学習モデル構築 models = sklearn_model(X_train, y_train) # 正解率確認 model = output_accuracy(models, X_valid, y_valid) if __name__ == '__main__': main() |

