前回「ファンダメンタル分析「バリュー投資」の実例」をまとめた。
かぶ1000氏のツイキャスを聞く限り、IRに電話したり、不動産投資的な現地に赴いて保有地を確認したり、定性的な分析活動こそバリュー投資の本質な気はしている。
一方で銘柄を絞るために定量的なスクーニングをしており、それぐらいなら自動化できそうなのでサンプルを作ってみた。
とはいえ、既に車輪の再発明。
同じ事を考える人は世の中に存在しており、githubを通してコードも公開している。
今回は、TDnetのパースのために、「XBRL to BS and PL」を利用した。
後で調べるとバフェット・コードの中身は下記を使っているようなので、こちらを使えば良かったと後悔・・・
出力したいパースを行うため、修正すべき部分は結構ある。
- Python3化
- 取得していない「有形固定資産」などの額を取得
- 「キャッシュ・フロー計算書」のパース
- YahooファイナンスをBeautifulSoupを使ってパース
追加した部分の一例を載せる(改変したコードをgithubに公開してよいのかな・・?)。
|
1 2 3 4 5 6 7 8 9 10 11 12 13 14 15 16 17 18 19 20 21 22 23 24 25 26 27 28 29 30 31 32 33 34 35 36 37 |
def read_cf(self, text): fields={} fields["depreciation_and_amortization"]=self.get_value("減価償却費","jppfs_cor:DepreciationAndAmortizationOpeCF",text) fields["operating_cash"]=self.get_value("営業活動によるキャッシュ・フロー","jppfs_cor:NetCashProvidedByUsedInOperatingActivities",text) fields["investment_cash"]=self.get_value("投資活動によるキャッシュ・フロー","jppfs_cor:NetCashProvidedByUsedInInvestmentActivities",text) fields["financing_cash"]=self.get_value("財務活動によるキャッシュ・フロー","jppfs_cor:NetCashProvidedByUsedInFinancingActivities",text) fields["cash_and_cashequivalents"]=self.get_value("現金及び現金同等物の期末残高","jppfs_cor:CashAndCashEquivalents",text) return fields import sys,requests, bs4 class YahooFinance(): def __init__(self,code): # インスタンス生成時に自動的に呼ばれるメソッド proxies = { "http":"", "https":"" } res = requests.get('https://stocks.finance.yahoo.co.jp/stocks/detail/?code=' + code, proxies=proxies) self.soup = bs4.BeautifulSoup(res.text,'lxml') def get_number(self, text): #正規表現 pattern = r'([+-]?[0-9]+\.?[0-9]*)' for m in re.findall(pattern, text): return m def get_value(self): elems = self.soup.select('div[class="lineFi yjMS clearfix"] strong') fields_mc={} fields_mc["key"] = self.soup.title.string.split(":")[0] fields_mc["marketcap"] = self.get_number(elems[0].getText().replace(",","")) fields_mc["dividend_yield"] = self.get_number(elems[2].getText().replace(",","")) fields_mc["per"] = self.get_number(elems[4].getText().replace(",","")) fields_mc["pbr"] = self.get_number(elems[5].getText().replace(",","")) fields_mc["eps"] = self.get_number(elems[6].getText().replace(",","")) fields={} fields["yahoo"]=fields_mc return fields |
このコードは、XBRL形式のzipファイルを与えれば、バランスシートなどの決算短信をパースし、数値を出力する。
更に、該当するYahooファイナンスのサイトを確認し、時価総額やPERなどを出力する。
これらを組み合わせてJsonを自動作成した結果が次の通り。
|
1 2 3 4 5 6 7 8 9 10 11 12 13 14 15 16 17 18 19 20 21 22 23 24 25 26 27 28 29 30 31 32 33 34 35 36 37 38 39 40 41 42 43 44 45 46 47 48 49 50 51 52 53 54 55 56 57 58 59 60 61 62 63 64 65 66 67 68 69 |
{ "bs": { "merchandise_and_finished_goods": 5375.0, "work_in_process": 277.0, "raw_materials_and_supplies": 4863.0, "property_plant_and_equipment": 9146.0, "cash_and_deposits": 23113.0, "notes_and_accounts_receivable_trade": 8255.0, "short_term_investment_securities": 2300.0, "investment_securities": 16607.0, "land": 5125.0, "buildings_and_structures": 17984.0, "buildings_and_structures_net": 3836.0, "allowance_for_doubtful_accounts_ioa_by_group": -5.0, "allowance_for_doubtful_accounts_ca": -1.0, "deferred_tax_assets_ca": 0, "deferred_tax_liabilities_ncl": 550.0, "current_assets": 46065.0, "assets": 71933.0, "liabilities": 7493.0, "net_assets": 64439.0, "liabilities_and_net_assets": 71933.0 }, "pl": { "current_accumulated_duration_net_sales": 49062.0, "current_accumulated_duration_operation_income": 176.0, "current_accumulated_duration_ordinary_income": 3451.0, "current_accumulated_duration_net_income": 3693.0, "current_accumulated_duration_net_income_per_share": 189.37, "current_accumulated_duration_dividend_per_share": 55.0, "current_year_duration_net_sales": 49062.0, "current_year_duration_operation_income": 176.0, "current_year_duration_ordinary_income": 3451.0, "current_year_duration_net_income": 3693.0, "current_year_duration_net_income_per_share": 189.37, "current_year_duration_dividend_per_share": 0, "next_accumulated_duration_net_sales": 24359.0, "next_accumulated_duration_operation_income": -300.0, "next_accumulated_duration_ordinary_income": 963.0, "next_accumulated_duration_net_income": 747.0, "next_accumulated_duration_net_income_per_share": 38.3, "next_accumulated_duration_dividend_per_share": 0, "next_year_duration_net_sales": 50816.0, "next_year_duration_operation_income": 391.0, "next_year_duration_ordinary_income": 3136.0, "next_year_duration_net_income": 2872.0, "next_year_duration_net_income_per_share": 147.24, "next_year_duration_dividend_per_share": 45.0, "net_sales_progress": 1.0, "operation_income_progress": 1.0, "ordinary_income_progress": 1.0, "net_income_progress": 1.0 }, "cf": { "depreciation_and_amortization": 307.0, "operating_cash": 399.0, "investment_cash": 3026.0, "financing_cash": -398.0, "cash_and_cashequivalents": 24513.0 }, "yahoo": { "key": "大平洋金属(株)【5541】", "marketcap": "43109", "dividend_yield": "2.04", "per": "14.96", "pbr": "0.67", "eps": "147.24" } } |
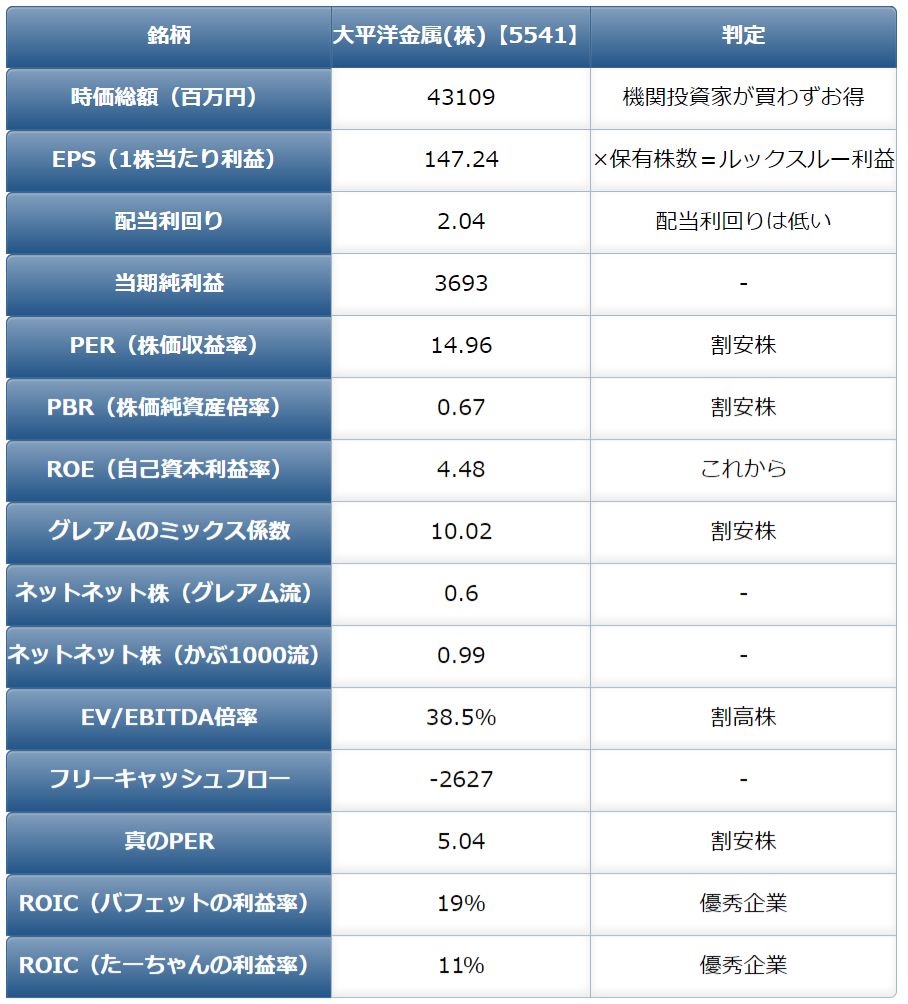
次に、Jsonを読み込み表示すれば良いのだが、初めて、Vue.jsとaxiosを使って作成してみた。
ほとんど、ネットのサンプルコード見ながら作成。
|
1 2 3 4 5 6 7 8 9 10 11 12 13 14 15 16 17 18 19 20 21 22 23 24 25 26 27 28 29 30 31 32 33 34 35 36 37 38 39 40 41 42 43 44 45 46 47 48 49 50 51 52 |
var app = new Vue({ el: '#app', data: { key: null, netnet1: null, netnet2: null, marketcap: null, }, methods: { async getCities() { var url = 'items.json' await axios.get(url) .then(function(response) { var bs = response.data.bs; var pl = response.data.pl; var cf = response.data.cf; var yahoo = response.data.yahoo; this.key = yahoo.key; this.dividend_yield = yahoo.dividend_yield; this.per = yahoo.per; this.pbr = yahoo.pbr; this.eps = yahoo.eps; this.interest_bearing_debt = 0.0; this.marketcap = yahoo.marketcap; this.merchandise_and_finished_goods = bs.merchandise_and_finished_goods; this.work_in_process = bs.work_in_process; this.raw_materials_and_supplies = bs.raw_materials_and_supplies; this.property_plant_and_equipment = bs.property_plant_and_equipment; this.cash_and_deposits = bs.cash_and_deposits; this.netnet1 = Math.round((bs.current_assets - bs.liabilities)*0.667); this.netnet2 = (bs.cash_and_deposits + bs.notes_and_accounts_receivable_trade + bs.short_term_investment_securities) + bs.investment_securities - (Math.abs(bs.allowance_for_doubtful_accounts_ioa_by_group) + Math.abs(bs.allowance_for_doubtful_accounts_ca) + bs.liabilities); this.operation_income = pl.current_year_duration_operation_income; this.ordinary_income = pl.current_year_duration_ordinary_income; this.net_income = pl.current_year_duration_net_income; this.depreciation_and_amortization = cf.depreciation_and_amortization; this.operating_cash = cf.operating_cash; this.investment_cash = cf.investment_cash; this.financing_cash = cf.financing_cash; this.cash_and_cashequivalents = cf.cash_and_cashequivalents; this.ev = Number(this.marketcap) + Number(this.interest_bearing_debt) - Number(this.cash_and_cashequivalents); this.ebitda = this.operation_income + this.depreciation_and_amortization; this.inventory = this.merchandise_and_finished_goods + this.work_in_process + this.raw_materials_and_supplies; }.bind(this)) .catch(function (error) { console.log(error); }); } }, mounted() { this.getCities() } }) |
こちらが、表示部分。
Vue.js特有な表現が多くあり、少し戸惑いながら作成。
jsファイルで計算すべきか、html内で計算すべきか正しい書き方は不明。
|
1 2 3 4 5 6 7 8 9 10 11 12 13 14 15 16 17 18 19 20 21 22 23 24 25 26 27 28 29 30 31 32 33 34 35 36 37 38 39 40 41 42 43 44 45 46 47 48 49 50 51 52 53 54 55 56 57 58 59 60 61 62 63 64 65 66 67 68 69 70 71 72 73 74 75 76 77 78 79 80 81 82 83 84 85 86 87 88 89 90 91 92 93 94 95 96 97 98 99 100 101 102 103 104 105 106 107 108 109 110 |
<html> <head> <meta http-equiv="Content-Type" content="text/html; charset=UTF-8"> <link rel='stylesheet' type="text/css" href="index.css" /> <script src="https://unpkg.com/axios/dist/axios.min.js"></script> <script src="https://cdn.jsdelivr.net/npm/vue/dist/vue.js"></script> </head> <body> <div id="app"> <table> <tr> <th>銘柄</th> <th>{{key}}</th> <th>判定</th> </tr> <tr> <th>時価総額(百万円)</th> <td>{{marketcap}} </td> <td v-if="marketcap >= 20000">機関投資家が買わずお得</td> <td v-else>機関投資家が買う</td> </tr> <tr> <th>EPS(1株当たり利益)</th> <td>{{eps}}</td> <td>×保有株数=ルックスルー利益</td> </tr> <tr> <th>配当利回り</th> <td>{{dividend_yield}}</td> <td v-if="dividend_yield < 3">配当利回りは低い</td> <td v-else>配当利回りが高い</td> </tr> <tr> <th>当期純利益</th> <td>{{net_income}}</td> <td>-</td> </tr> <tr> <th>PER(株価収益率)</th> <td>{{per}} </td> <td v-if="per <= 15">割安株</td> <td v-else>割高株</td> </tr> <tr> <th>PBR(株価純資産倍率)</th> <td>{{pbr}} </td> <td v-if="pbr <= 1">割安株</td> <td v-else>割高株</td> </tr> <tr> <th>ROE(自己資本利益率)</th> <td>{{Math.round(pbr/per*100*100)/100}} </td> <td v-if="Math.round(pbr/per*100*100)/100 < 0">欠陥企業</td> <td v-else-if="Math.round(pbr/per*100*100)/100 <= 19">これから</td> <td v-else-if="Math.round(pbr/per*100*100)/100 <= 39">普通企業</td> <td v-else-if="Math.round(pbr/per*100*100)/100 <= 69">優秀企業</td> <td v-else>理想企業</td> </tr> <tr> <th>グレアムのミックス係数</th> <td>{{Math.round(per*pbr*100)/100}} </td> <td v-if="Math.round(per*pbr*100)/100 <= 11.25">割安株</td> <td v-else>割高株</td> </tr> <tr> <th>ネットネット株(グレアム流)</th> <td>{{Math.round(netnet1/marketcap*100)/100}} </td> <td v-if="Math.round(netnet1/marketcap*100)/100 >= 1">ネットネット株</td> <td v-else>-</td> </tr> <tr> <th>ネットネット株(かぶ1000流)</th> <td>{{Math.round(netnet2/marketcap*100)/100}} </td> <td v-if="Math.round(netnet2/marketcap*100)/100 >= 1">ネットネット株</td> <td v-else>-</td> </tr> <tr> <th>EV/EBITDA倍率</th> <td>{{Math.round(ev/ebitda*100)/100}}%</td> <td v-if="(ev/ebitda*100)/100 < 10">割安株</td> <td v-else>割高株</td> </tr> <tr> <th>フリーキャッシュフロー</th> <td>{{operating_cash-investment_cash}}</td> <td>-</td> </tr> <tr> <th>真のPER</th> <td>{{Math.round((marketcap-cash_and_cashequivalents)/net_income*100)/100}}</td> <td v-if="((marketcap-cash_and_cashequivalents)/net_income*100)/100 <= 8">割安株</td> <td v-else>割高株</td> </tr> <tr> <th>ROIC(バフェットの利益率)</th> <td>{{Math.round(net_income/(inventory + property_plant_and_equipment)*100)}}%</td> <td v-if="net_income / (inventory + property_plant_and_equipment) >= 0.1">優秀企業</td> <td v-else>稼ぐ力が低い</td> </tr> <tr> <th>ROIC(たーちゃんの利益率)</th> <td>{{Math.round(ordinary_income*0.6/(inventory + property_plant_and_equipment)*100)}}%</td> <td v-if="ordinary_income*0.6/(inventory + property_plant_and_equipment) >= 0.1">優秀企業</td> <td v-else>稼ぐ力が低い</td> </tr> </table> </div> <script src="index.js"></script> </body> </html> |
これらを、全銘柄で実施すれば、「割安株検索」のようなサイトが作れるはず。
「TDnetSearch」では、GoogleChartなどを使って数年前のデータ含めてグラフ出力している。
さくらインターネットの今の契約だと、数十分かかるスクリプトが自動的に止められてしまうので、定常的に出力するには、どうしたらよいものか・・。
まとめ
今は、各指標の言わんとする意味の学習に費やす予定。
結局「四季報」や「有価証券報告書」を使わずに、必要な指標の算出が完了した。何も理解できてない。
「EV/EBITDA倍率」などの計算に利用している指標も正しいのか不明・・・。前回の計算とも結果が大きく違い過ぎる。。。
ネットネット株やPBR1倍な株をスクーニングしてみたが、ボロ株が多い印象・・・
だから定性分析が必要なのだろうが、
砂から砂金・・・というか、砂漠から砂金
に近いな・・
とはいえ、消費税増税、景気悪化、オリンピック終わり・・、少し世間の株に対する熱が冷めれる頃に参戦できるように用意しておきます。
でも、昨年の12月の米中関係問題で株価下がった時に何もできませんでした。結局、心理負けして無理なのかな・・。


